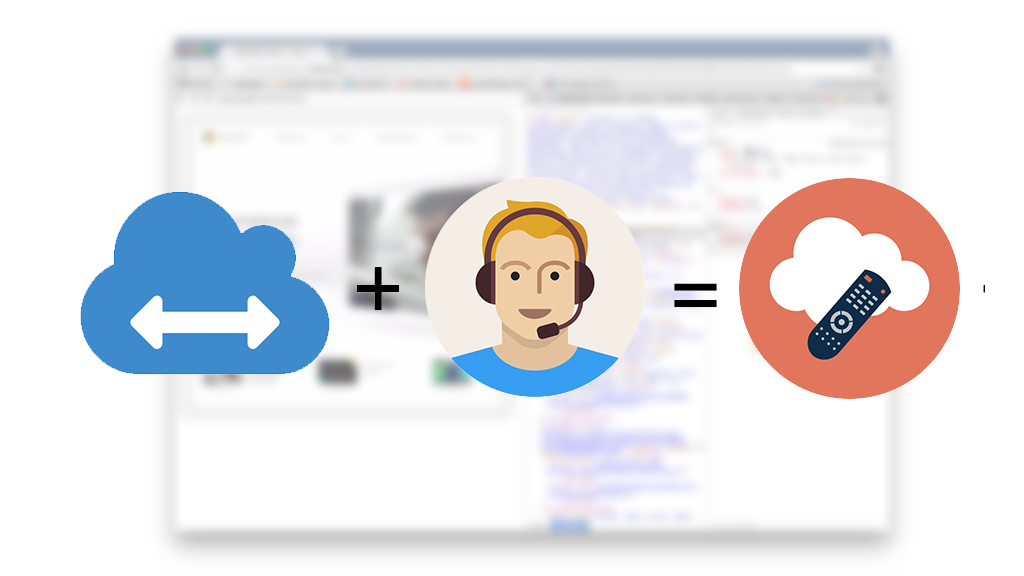
As a part of my talk about the future of DevTools and my RemoteDebug initiative at JSCamp in Romania, I build a little prototype I’d like to introduce. It’s called BrowserRemote.

Preface: My intention with BrowserRemote is to show-case the powerfullness of exposing remote debugging, in a secure manner, to application developers via an injected API, and to show that remote debugging can be valuable for end-users too.
BrowserRemote enables you to remote support or assist your users directly from the browser, within your own web app. No need to install anything, just click a button. This is kinda the nirvana of web support, as most of the support agents today ends up asking the user in trouble for screenshots, browser details, etc. BrowserRemote eliminates all of that by making it possible for the support agent to pull the needed information – remotely.
How does BrowserRemote work?
BrowserRemote works by an chrome extension that injects a window.remoteDebug object which exposes a method named getDebugSocket(<sourceName>), which can be invoked from within the viewport. Once called a simple permission prompt is shown, and once granted, the extension invokes the internal extension-only chrome.debugger API. Once the extension is attached to the debugger it connects to a proxy server via socket.io and simply forwards the data from the debugger to the proxy.
<img src="/images/posts/browser-remote/flow.png" />
The proxy server is then exposing a RemoteDebug-compliant WebSocket endpoints together with a HTTP interface, that enables any RemoteDebug-compliant tool to connect to it.
This means a support agent can tools like Chrome DevTools or Chrome DevTools App, to the proxy server, and use the tool as it were attached to local computer. No need new tools, we can simply reuse the existing.
Screencasting as a key feature
After building the proxy server I realized that being able to connect to a browser remotely is good, but if you can’t see the rendered viewport, it’s no good, as you have no idea what you are inspecting.
I therefore looked into Chrome DevTools screencasting functionality, to see how it worked, and if I could emulate it for BrowserRemote. It didn’t take me long to get something working by using the internal chrome.tabs.captureVisibleTab API, but the frame-rate wasn’t good, resizing and other things didn’t work.
So I dug a bit deeper and then it occurred to me: Chrome on Android already supports screencasting, so it's already in the Chromium codebase. There must be a way to enable it for Chrome on desktop and there was!
If you simply fake the response of the Page.canScreencast method to enable screencasting, Chrome on desktop will actually respond to Page.startScreencast, and other related screencasting methods.
Yay. I could remote my ugly hacks. Much better!
<img src="/images/posts/browser-remote/screencasting.jpg" />
So with BrowserRemote screencasting works for desktop browsers too, and when using Chrome DevTools you are able to get a live-preview of the rendered viewport. This is quite powerfull, as you now connect remote to a browser, see the rendered output while inspecting and debugging the application. Just like being in front of the computer.
Perspective a DebugSocket API
BrowserRemote is highly experimental demoware, and shouldn’t be used in in any production like environment, as there’s no security or privacy. Anyone can connect to anyone.
However the perspective of being able to connect remotely to a browser-instance over the internet, after the user has granted permission, opens a new perspective on tooling.
What if companies like Zendesk integrated with the browsers remote debugging protocols to build better support tools? What if the browser vendors exposed a “debugSocket” to application developers? This could for example enable web-based editors like Cloud9 to remote-debug a specific browser tab, maybe provide a live-preview of the authored application? There's many new opportunities, and probably a bunch of tools we haven't imagined yet.
And yes, there's probably a better name than window.remoteDebug.getDebugSocket too :)
Security considerations
Enabling remote access to the browser via the remote debugging protocol opens up a new potential attack vector to the browser, as having access to the debugSocket enables the connected client to do a lot of powerfull things.
I don’t see that as an added security risk as long the permission is modeled after similar API's such as getUserMedia. As long the user is prompted for permission and the permission is scoped to the current browser tab/window, then I think we have a good starting point.
<img src="/images/posts/browser-remote/permission.gif" />
Today Chrome already enables a similar behavior via Chrome extensions, so I don’t see any reason why we couldn’t build this API directly into our browsers and combine it with the new Web Permission API. If you take a look at the source code of the chrome extension, it's a really simple polyfil that act's as a proxy to simply the API on the window object. That's it.
Going forward
Back in 2013 I actually open an issue in the Chrome tracker as I wanted to have a discussion about this, but we never had it. So here two years later, let’s try again.
What do you think? What’s your perspective on such a debugSocket API?
The code is available on GitHub, and is MIT licensed, so feel free to experiment with it.
That’s it for now.
/k