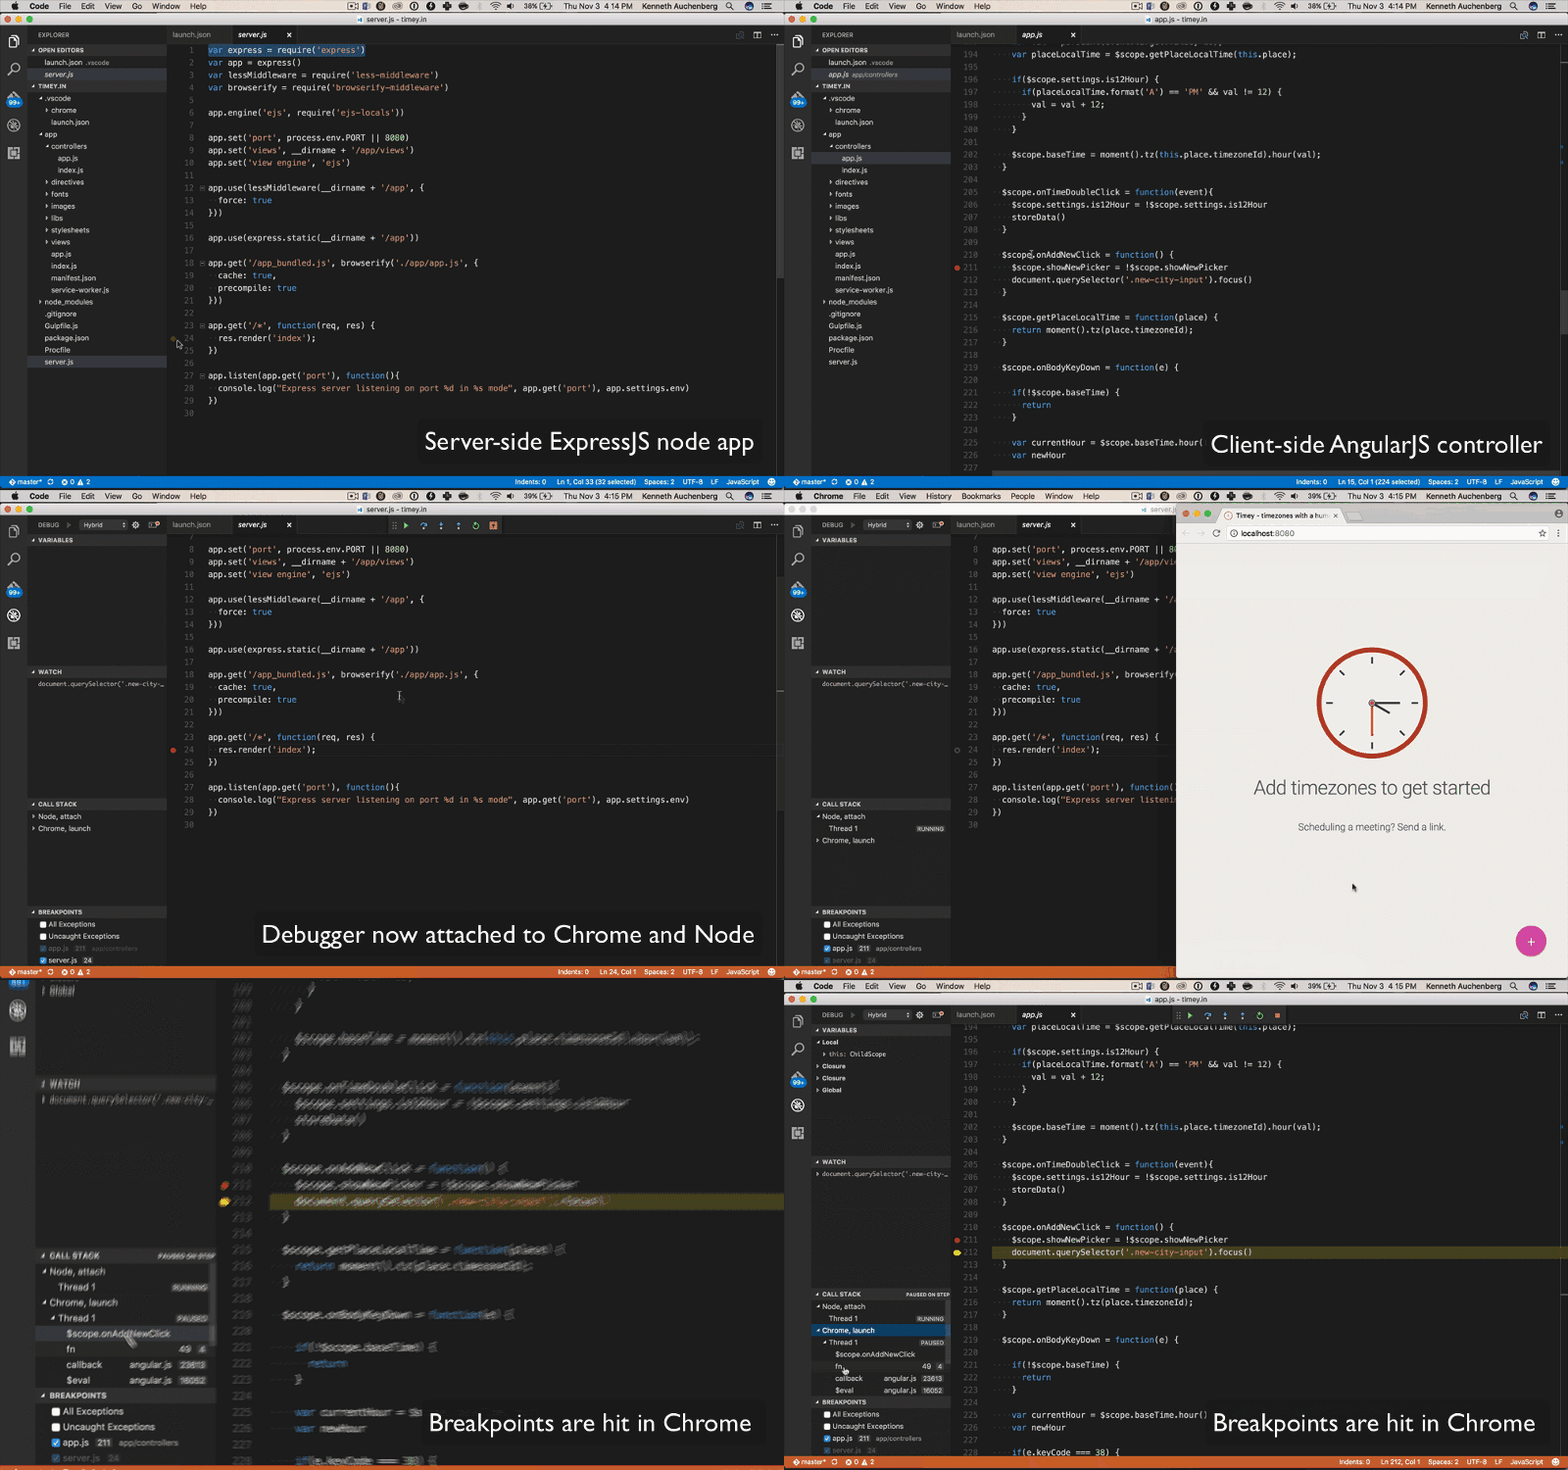
In Visual Studio Code 1.7 we shipped a new experimental feature called “multi-target debugging”, which enables VS Code to start multiple debuggers from the same instance of the editor.

For the web folks, this means we can connect VS Code to browsers and back-ends simultaneously using our debuggers, and enable what I call “nirvana debugging” where you as a developer can debug your code running in the client and server straight from your editor.

Debugging client-side and server-side code directly from your editor
The best way to show the value is by example, so I’ve put together an AngularJS-based client-side app, that runs on top of a server-side ExpressJS Node app, which uses WebPack to bundle and minify the client-side bits before servering the files. What happens in the demo below, is a continuous debugging experience that shows the transition from server-side debugging to client-side debugging (transparent via source maps) with the press of a button.
This means no more switching between tools. Just press F5, and debug your code regardless of where it’s running. The future of unified JavaScript debugging has arrived! 🎉🎈
Any browser, any server-side code
The architecture of VS Code allows debuggers independently of their underlaying protocol to work with the editor. In the example I showed Chrome and Node.js debugging, but this flexible architecture means it’s easy to imagine scenarios where VS Code for example is attached to Edge and debugs server-side .NET code, or debugging Safari Mobile with a Go back-end.
As long as there’s a debugger available for VS Code, it should work (in theory 😉)
How do I try this?
- To get started you need the latest version of VS Code Insiders, and make sure you have installed our Chrome Debugger.
- From here you can use the following launch.json config to setup a new “hybrid” target via the new composite-type:
- Start your node server with debugging enabled by running:
node --inspect <your server file>.js - Start debugging by pressing the green debug icon or simply just F5
Bam, we have a debug party! 🎉🎈
Experimental sticker warning
This new “multi target debugging” feature in VS Code is brand new and experimental, so there might be a few rough edges that needs improvement, but please don’t hesitate to try it out!
/k