To continue the RemoteDebug effort on unifying today’s remote debugging protocols and API’s for browsers and related runtimes, I spend some time comparing the API's exposed over remote debugging protocols.
Today I'm happy to introduce the RemoteDebug Compatibility Tables, which for the first time provides a full overview the API’s exposed by browsers and runtimes supporting the Chrome Debugging Protocol either natively or via protocol adapter.
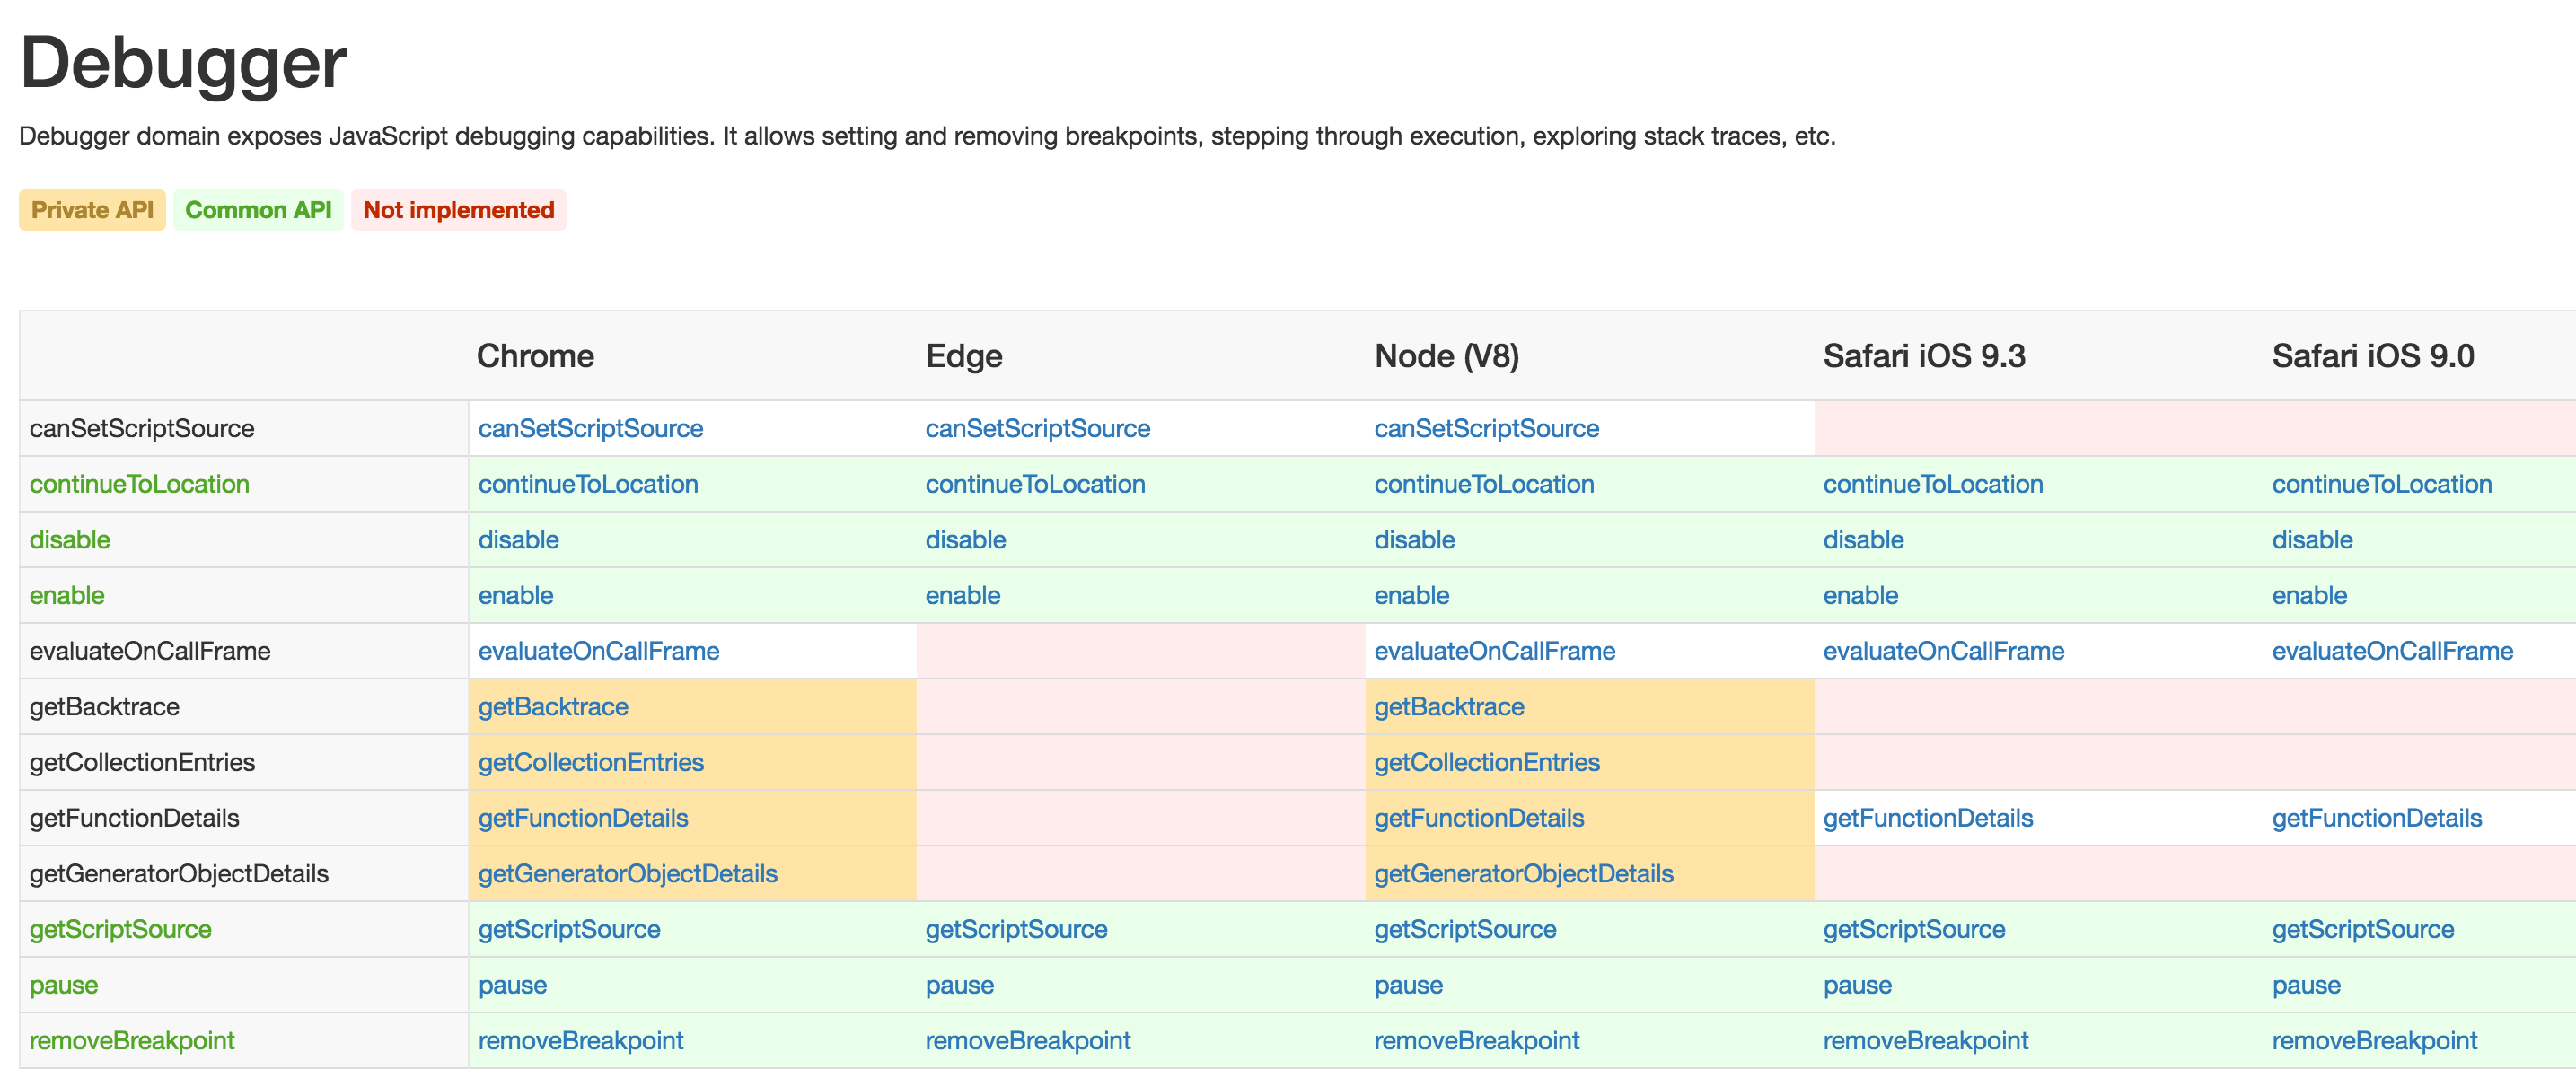
As a starting point the RemoteDebug Compatibility Tables compares the API exposed by the following runtimes:
- Node (master)
- Google Chrome
- Microsoft Edge (via Edge Diagnostics Adapter)
- Safari iOS 9.3
- Safari iOS 9.2
- Safari iOS 8.0
- Safari iOS 7.0
Using node and protocol.json files to compare API's
The compatibility tables are generated on the fly in a little 300 line Node app, that loads the protocol.json files provided by each runtime, and renders compatibility tables for domain objects, events, and methods exposed by the runtimes. This makes it easy to keep the compatibility tables up to date, but also means that if a new runtime would gain support for the protocol and provide a protocol.json it's a very simple operation to add it to the compatibility tables.
This approach is much similar to the excellent Chrome Debugging Protocol Viewer by @paul_irish and @kdzwinel, but I've added multiple runtimes as a new dimension. It means that the RemoteDebug Compatibility Tables also serves as a runtime specific protocol viewer, that for examples enable developers to browse iOS 9.3 Safari specific methods like Page.snapshotNode.
Highlighting common and private APIs
Besides, to generating the compatibility tables themselves and permalinks for each object, I've also some simple API comparison which marks a given API as "common" when all the compared runtimes support's it. There's a surprisingly large amount of common API's already.
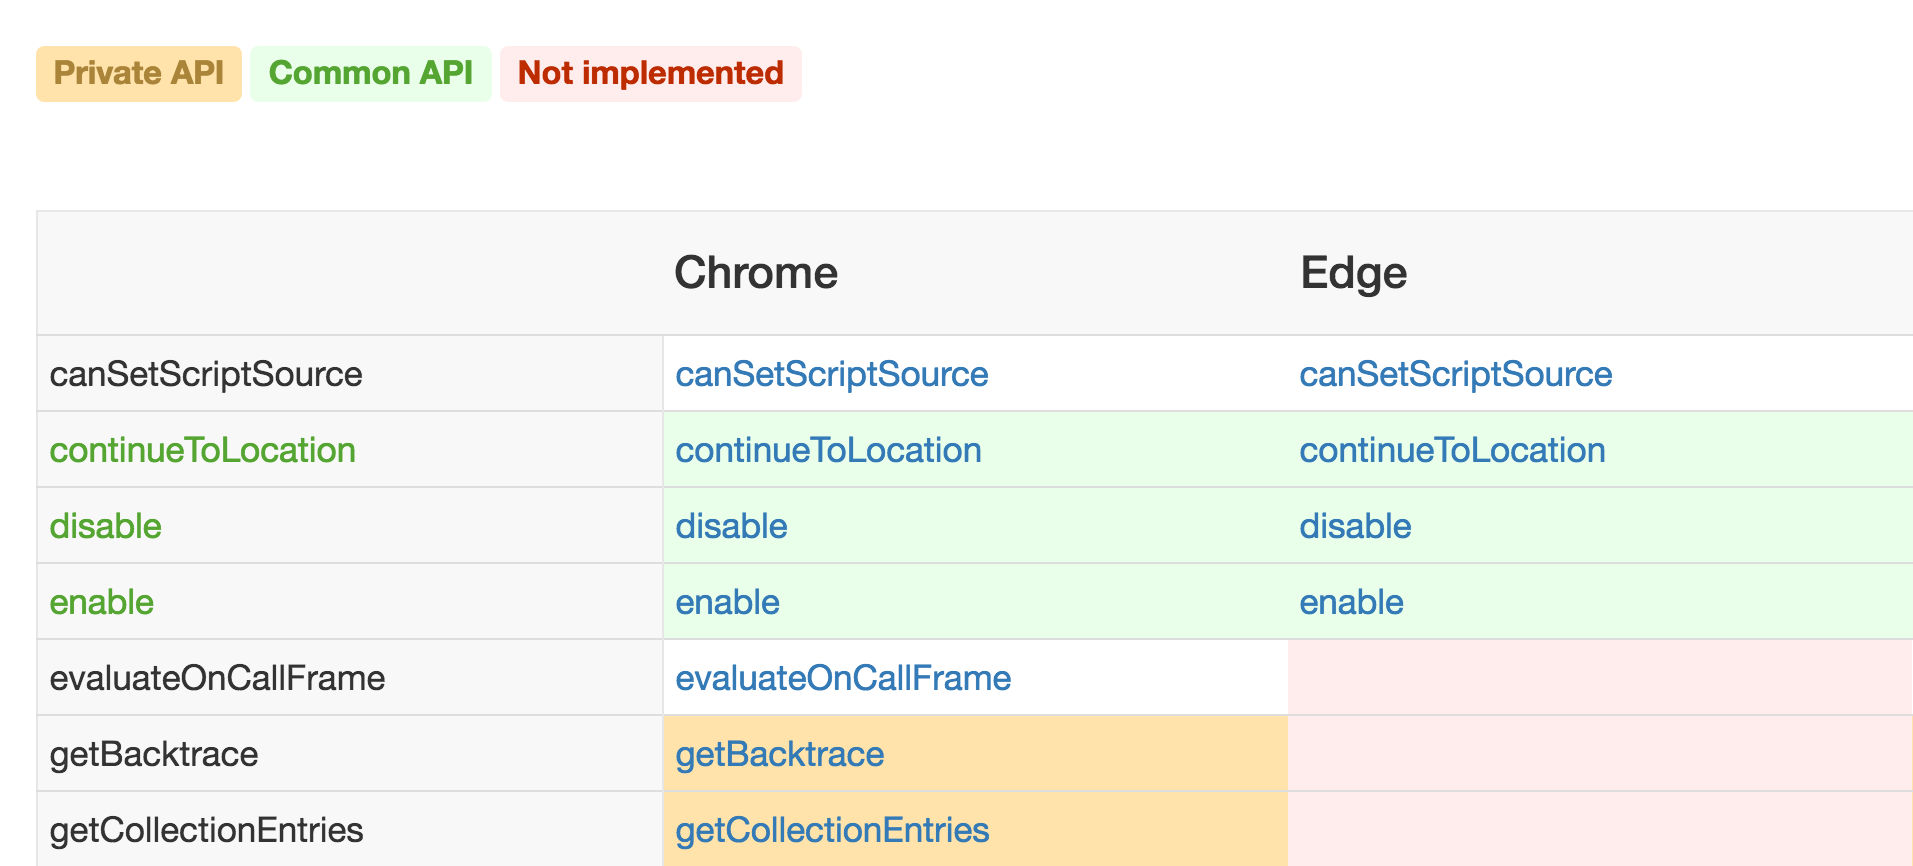
Getting an overview of common API's is the first step towards a RemoteDebug proposal as those API's would be a good starting point for a common set of APIs, as they already are supported and exposed today.
Lastly, I've also added highlighting of "private API's" as those can change without warning and should be used sparsely. Highlighting these are an important step towards getting an overview of how much of the API surface exposed by each runtime that are in flux.
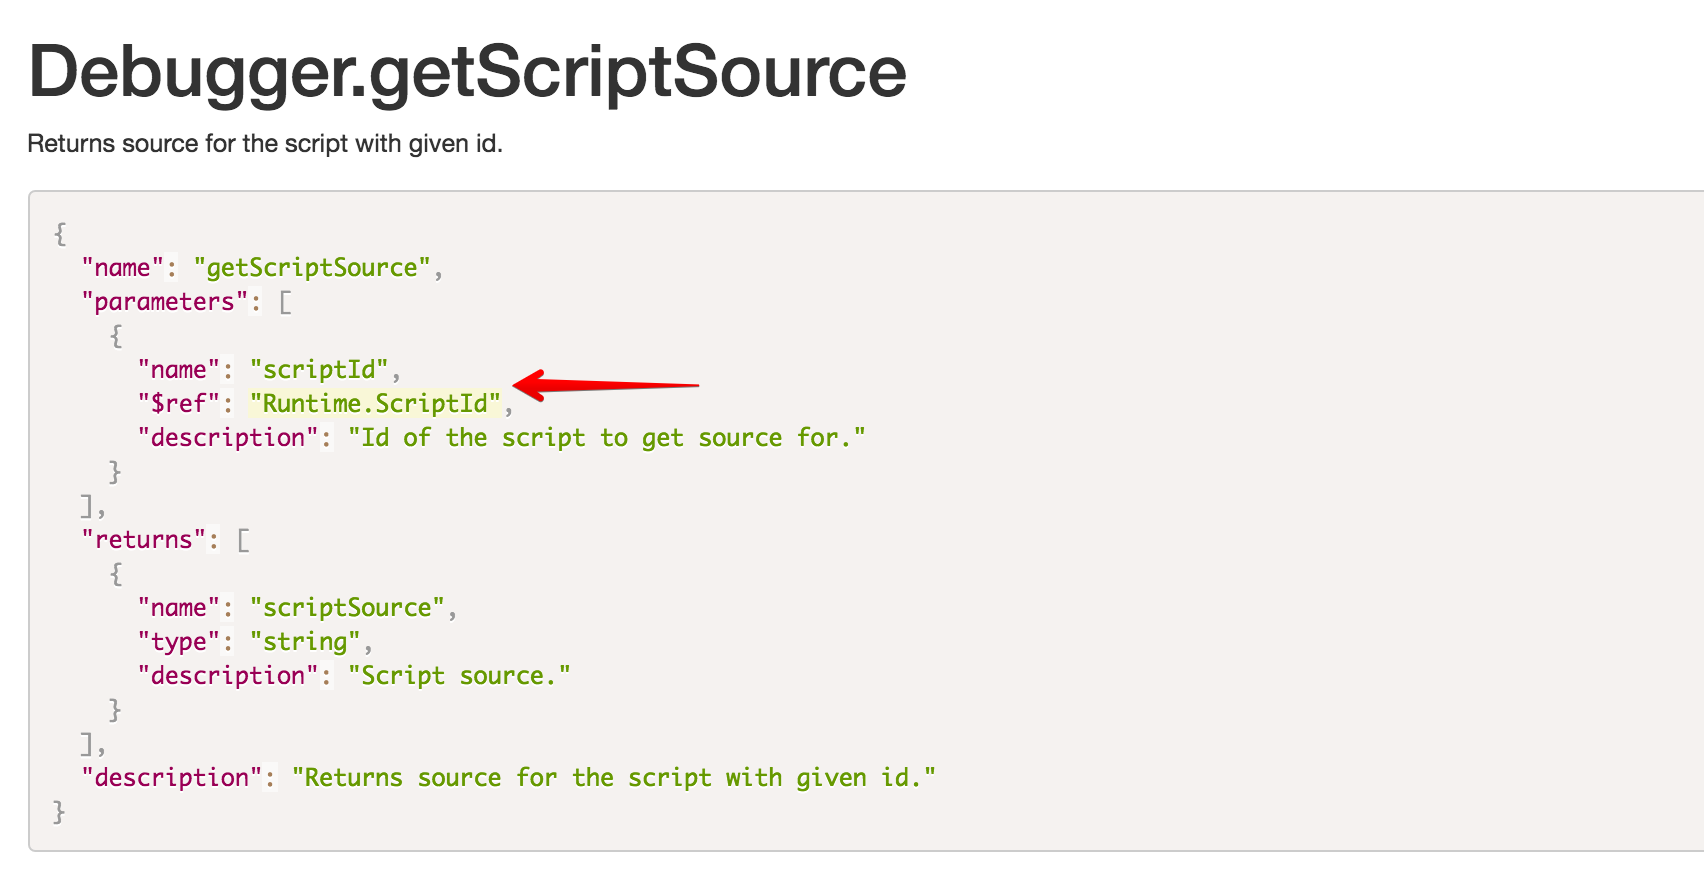
Inline code navigating between object references
To make navigation between methods and their return objects, I also added inline code navigation much inspired by Chromium Code Search, which detect $ref object references and generates links to the relevant object and runtime.
The JSON highlighting powered by Prism.js, and the inline code navigation is done via an relatively straightforward Prism extension, which makes code navigation for Debugger.getScriptSource a breeze to use.
One step closer towards the RemoteDebug vision
In June Google contributed to Node in the v8_inspector pull request, which added the Chrome Remote Debugging Protocol directly to Node core. It's a significant step forward for Node and the tooling ecosystem in general but also makes the RemoteDebug vision more relevant than ever.
As of July 2016 I see a need in both the Node and web community for a common set of APIs and a place where vendors and the community can work together on designing the current and future API's exposed over the Chrome Debugging Protocol.
I hope this new overview can help the community coming together to a common set of APIs exposed over the same remote debugging protocol. The code is fully open source and available on GitHub, and if you find a bug or think a feature or runtime is missing, don’t hesitate to contribute.
/k