Finding and identifying issues with Node.js apps deployed to the cloud can be burdensome process that usually involves local debugging, the sprinkling of console.logson to your codebase, and many re-deployments to get the problem identified and solved.
Today we are changing that, as we are introducing a public preview of remote debugging for Node.js apps deployed on Azure App Service for Linux. Our remote debugging experience brings you the same great debugging experience that you already know from Visual Studio Code when debugging Node.js locally to the Azure Cloud.
How it works
Remote debugging for Azure App Service works by taking advantage of a new Azure mechanism that allows us to forward the remote debugging information from your Node process running in Azure to your local computer in a secure way. Once the connection is established we can take VS Code’s built-in Node.js debugger to attach and debug — just like if you were debugging your Node app locally!
You can read more about how it works, and other Azure App Service announcements here on the Azure blog.
How to get started
To get started you first have to prepare your Node.js app running in Azure and setup Visual Studio Code. Let me show you how.
Preparing your Node.js app on Azure
This section assumes that you already have your Node.js app deployed to Azure using Azure App Service for Linux. If you haven’t deployed your app you can get started here or using the Azure CLI here.
In order to enable remote debugging when your app is running in the cloud, you might need a make a slight modification to your Node app, depending on how you start your app.
Per our default logic for Node Apps on Azure, we’ll try to auto-detect how you start your Node app, if you use bin/www server.js app.js hosting.js or index.js as your main script file. If that’s the case, there’s some good news: You don’t have to change anything!
When using NPM scripts to start your Node app
If you are using NPM scripts to start your Node app, you need to make a slight modification to how you start your app, as we won’t try to fiddle with your app. You know best how to launch your app, so for this public preview, we are asking you explicitly to create a new debugging specific NPM script that runs your Node app with --inspect=0.0.0.0:$APPSVC_TUNNEL_PORT.
This runtime flag tells your Node app to start in debug mode listening on the debugging port specified by Azure, which is exposed as an environment variable.
Your scripts section in your package.json should look something like:
"scripts": {
  "start": "node index.js",
  "start\_azure\_debug": "node --inspect=0.0.0.0:$APPSVC\_TUNNEL\_PORT index.js"
}
The next step is to go to Azure Portal, and find your deployed Node.js app on Azure App Service (Linux).
Go to Application settings and update your Startup File to your newly configured npm run start_azure_debug script.
It should look something like:
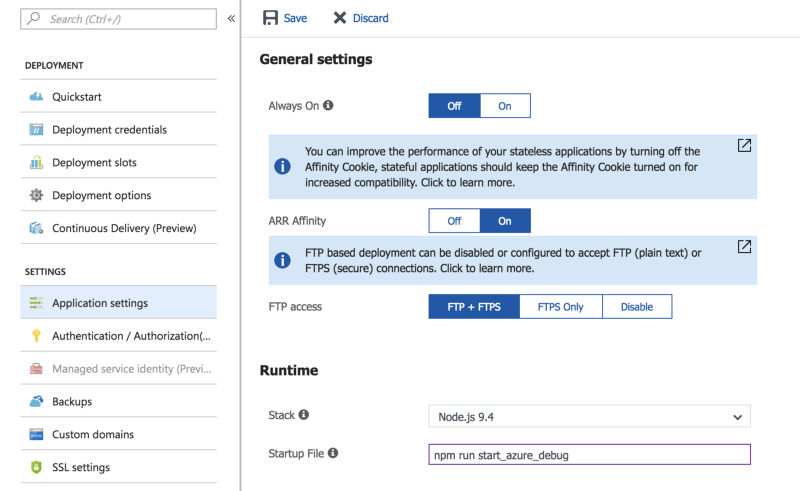
Your Node app is now figured to run with remote debugging enabled.
Yay! 🎉🔥
Debugging from Visual Studio Code
Next is to get your Visual Studio Code setup going, which is an easy process:
- Install Visual Studio Code, if you haven’t.
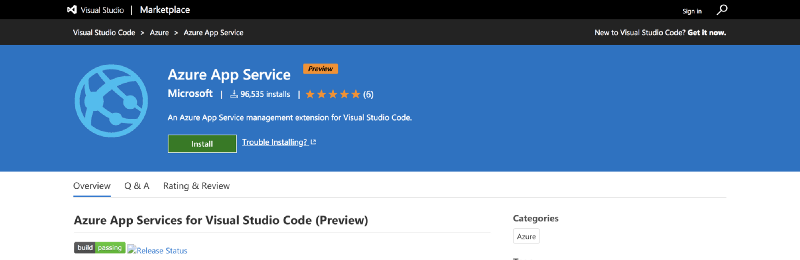
- Install the Azure App Service extension for VS Code by either clicking the link or search for it in the marketplace directly from VS Code
3. If you haven’t logged into Azure from VS Code, you should now click the Azure icon in the sidebar to the left, and login to see your App Service apps.
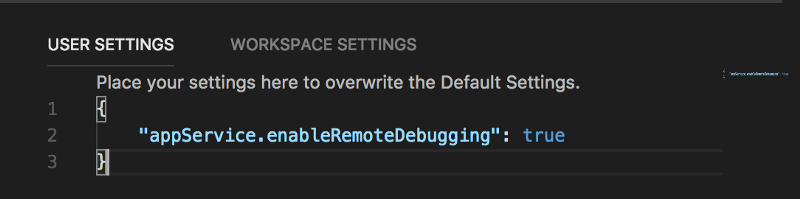
4. Since remote debugging is a preview feature, you now have to go to your VS Code settings to enable it. You do this by clicking File > Preferences > Settings. modify your appService.enableRemoteDebugging to be true.
5. Now that you have remote debugging enabled, the next step for you is to open the source code for your Node app as your workspace in VS Code.
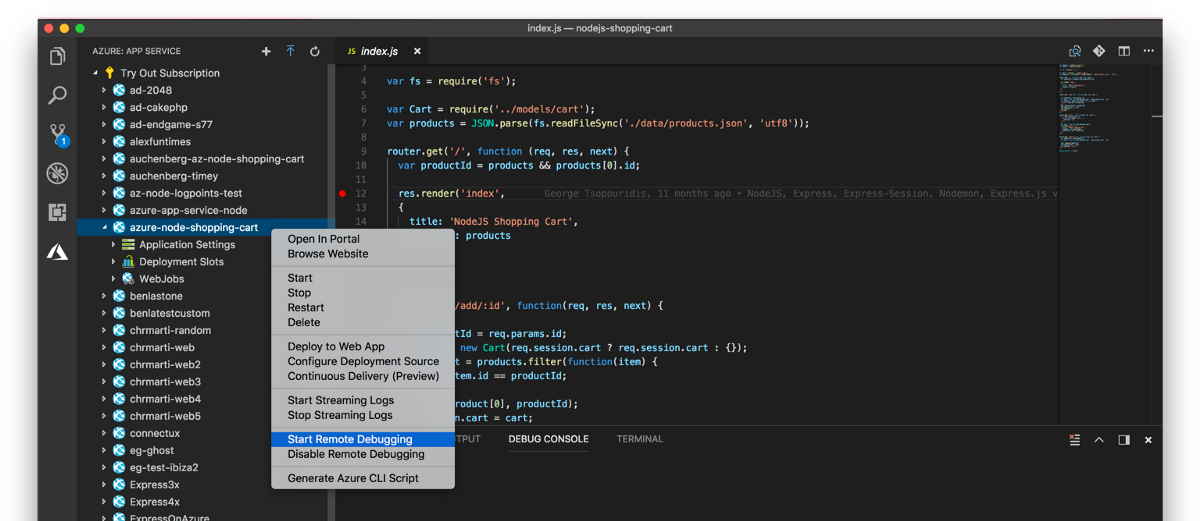
6. Once you have the source code open next is to find your deployed Node app in the Azure App Service list within VS Code.
Right click and select the new “Start Remote Debugging” option.
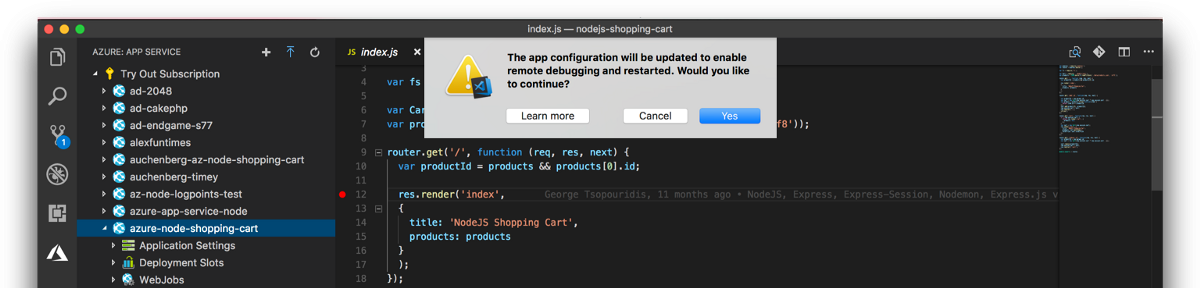
Once clicking on “Start remote debugging”, Visual Studio Code will check if remote debugging has been enabled for your app, and if it hasn’t you will be asked to confirm before enabling remote debugging on your behalf.
Once the right configurations has been set, you should now see remote debugging for your Node.js app being started (you can follow the progress in the status bar) and once the debugger is connected VS Code will enter debug mode.
Notice: You might get a prompt from your firewall on Windows, please allow the connection
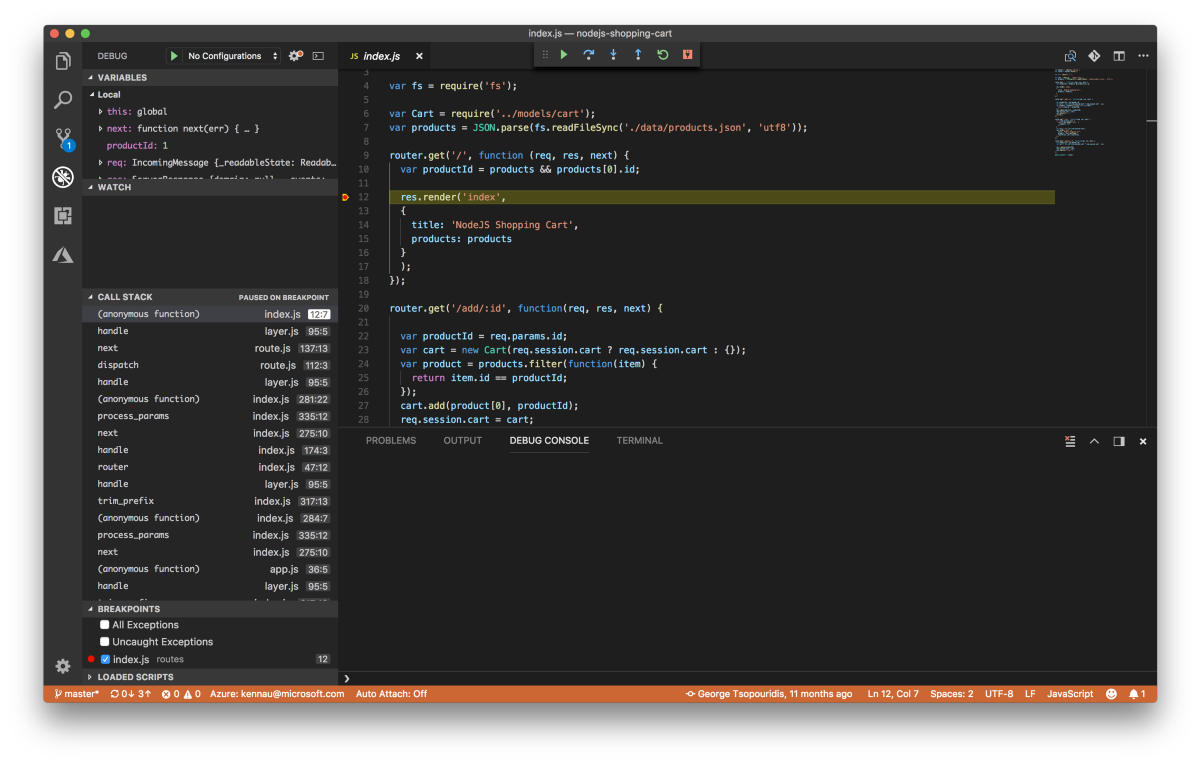
Bam. That’s it. 🎉🔥
The debugger is now connected, and you can remote debug your Node.js app running in Azure! Try set a breakpoint!
Take advantage of Logpoints in VS Code with Azure
In the March 2018 release of VS Code, we introduced a new debugging concept called Logpoints. When combining Logpoints with remote debugging on Azure you have a powerful combination for seamless production debugging!
Try it out and read more about Logpoints here 👉https://code.visualstudio.com/updates/v1_22#_logpoints
Try out the preview!
We are excited to bring you real remote debugging for Node.js apps running on Azure App Service (for Linux) directly from Visual Studio Code. Giving you a simply integrated experience that allows you to easily debug and diagnose problems if they occur when running your Node.js apps in our Cloud.
We’d love to hear your feedback: Please find us in GitHub to report issues, provide suggestions, or tell us your success stories.
Happy coding!
/k