Today, I’m happy to announce a new project, RemoteDebug iOS WebKit Adapter, which enables Safari and WebViews on iOS to be debugged from tools like VS Code, Chrome DevTools and Firefox debugger.html on both Windows and Mac.
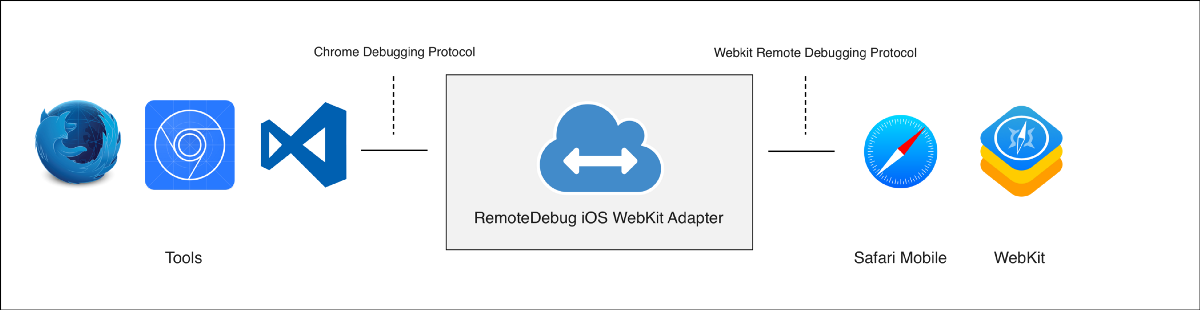 RemoteDebug iOS WebKit Adapter overview
Purpose
This adapter enables debugging of Safari/Webkit on iOS from Chrome Debugging Protocol (CDP) based tools. The scope of the project is to provide a protocol adapter that handles the API differences between the Chrome Debugging Protocol and Webkit Remote Debugging Protocol. The project is continuation of the existing ios-webkit-debug-proxy project, by building on top.
Goal
I hope by having an open source protocol adapter we can unite the energy and resources that, until now, had been put into keeping Apache Cordova and iOS WebKit/Safari web debugging work for a various number of tools and clients. With one central protocol adapter that adheres to the Chrome Debugging Protocol (CDP) API, tools can focus on implementing the that API, and let compatibility be handled by the protocol adapter.
Architecture
The protocol adapter is implemented in TypeScript as Node-based CLI tool which starts an instance of ios-webkit-debug-proxy, detects the connected iOS devices, and then starts up an instance of the correct protocol adapter depending on the iOS version.
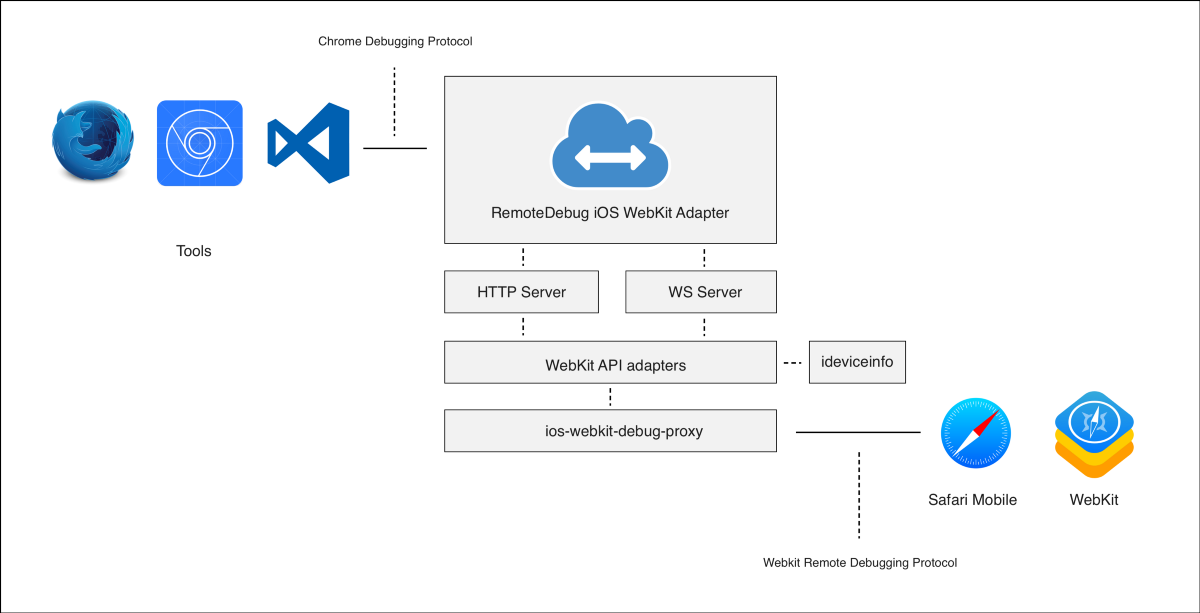 RemoteDebug iOS WebKit Adapter architecture
The iOS version detection relies on ideviceinfo from libimobiledevice, and is needed because the API exposed over the WebKit Remote Debugging Protocol has small variations depending on the WebKit version. As a starting point API differences from iOS 10 down to iOS 8 has been implemented and the implementation can be seen here.
Finally, the adapter is exposing a WebSocket server and a HTTP server, which are compliant to CDP, which means there’s no difference for the external tools, whether they are connected to a Chromium-based runtime or the adapter.
The adapter in a nutshell
The protocol adapter enables a broad range of features that hasn’t been working for a long time to the growing delta between the APIs exposed by Chromium and WebKit.
- DOM / CSS editing
Implements a range of basic DOM/CSS APIs which enables basic element inspection and CSS manipulation. - Console
Enables the console to function as expected, by mapping the WebKit APIs to the new Chrome APIs. - Network tool Enables the network tool to function as expected, and re-enables cookies to be set and deleted.
- Script debugging Debugging of scripts and enables usage of the debugger-statement from VS Code, debugger.html and Chrome DevTools
- Screencasting As a little extra thing the protocol adapter also enables a basic version of screencasting via Chrome DevTools, as we discovered WebKit supports taking screenshots of the viewport via the Page.snapshotRect API. This enables us to emulate the screencasting behavior of Chromium, with the caveat of performance is sub-pair with the native implementation, and touch emulation isn’t fully implemented. The experience is limited, but conceptually it works.
 Screencasting from iOS Simulator to Chrome DevTools
Getting started
RemoteDebug iOS WebKit adapter works both on Windows and MacOS, and to get started simply install the adapter via NPM:
Depending on your OS there might be special dependencies needed, please follow the instructions in the README for more details.
Using the adapter with Chrome DevTools, VS Code and Firefox debugger.html
To get started you first need to start the adapter from your favorite command line:
Once the adapter is running you can configure Chrome DevTools to discover “Network targets” by following this guide, or you can start the adapter running on port 9222, which enables Firefox debugger.html to work with it.
Alternatively you can also configure VS Code to use port 9000with the following launch.json config, and enable easy debugging directly from your editor.
Thanks to Microsoft for sponsoring the work
This project started as an internal Microsoft experiment with the aim to enable Visual Studio, VS Code and other tools to transparently target different runtimes, as we today have debuggers based on CDP used for Node and Chrome debugging.
Today the project has been donated to RemoteDebug GitHub organization, and open-sourced under MIT. This is a one-time commitment from Microsoft and means Microsoft won’t be maintaining the project going forward.
A big thanks to my employer Microsoft for allowing me, and the rest of team to spend time on making this project a reality. A particular thanks to James Lissiak for outlining the architecture, crunching through the API differences and figuring out the screencasting bits.
Going forward
The next step for RemoteDebug iOS WebKit adapter is to implement the 32 remaining APIs, which would give the adapter coverage of the public APIs in the Chrome Debugging Protocol, which I hope the community can help with.
The adapter isn’t perfect, and it’s still early days, but it takes over from where the ios-webkit-debug-proxy project left, and enables more tools to debug WebKit on iOS which is great! Profiling is still one of the bigger things that needs to get tackled, but I imagine it will be hard to do, as the underlaying data model between WebKit and Chrome simply has diverged too much. That said, if possible, it could enable some interesting tooling scenarios as tools like Lighthouse and CalibreApp would work with WebKit.
What’s next for RemoteDebug
The effort for RemoteDebug is still continuing with the goal to introduce a standardized Core Debugging Protocol that isn’t owned by one vendor with an open governance model that allows multiple vendors to collaborate.
The RemoteDebug effort should be combined with “RemoteDebug test suite” that would allow us to validate the compatibility across runtimes and ensure that tools such as VS Code, debugger.html and others works as expected. This testing effort hasn’t begun yet, but with RemoteDebug iOS WebKit Adapter in place, we now have the first test target in addition to the native Chrome implementation.
Please give the RemoteDebug iOS WebKit Adapter a try, open issues and contribute with ideas for improvements on GitHub.
/k
(Thanks to Ben Schwarz, James Lissiak, Jason Laster, Konrad Dzwinel & Andy Sterland for reviewing this post)